一、技术总结 1.屏幕适配 通过window.screen.width获取系统屏幕宽度,计算出与设计稿的比例,用document.body.style.zoom对页面进行比例缩放
1 document .body.style.zoom = window .screen.width / 1920
2.高德地图 为什么选择高德地图呢?经过前期调研,高德地图渲染比较流畅,过渡比较自然,百度地图会出现白色的色块,不太符合大屏项目的气质。而且高德地图api也很完善,能满足开发的需求。
(1)地图引入
脚本引入
1 2 3 4 5 6 7 8 <script src="//webapi.amap.com/maps?v=1.4.15&key=d87dc2da5a41ae6fd9d135acaa50989d& plugin=AMap.CustomLayer,AMap.DistrictLayer,AMap.DistrictSearch,AMap.Scale,AMap.ToolBar,AMap.Geocoder" ></script>
创建实例
1 2 3 4 5 6 7 8 9 10 11 12 13 14 15 16 17 let dom = document .getElementById("map" )let map = new AMap.Map(dom, { pitch: 30 , viewMode: '3D' , zoom: 4.5 , dragEnable: false , resizeEnable: false , expandZoomRange: false , zoomEnable: false , center: [118.590936 , 40.784202 ], mapStyle: "amap://styles/41484b023e45e8db0730860bb21ce8de" , rotation: 0 , }) <div id="map" style={{ width : "1920px" , height : "1080px" , background : '#000' }}></div>
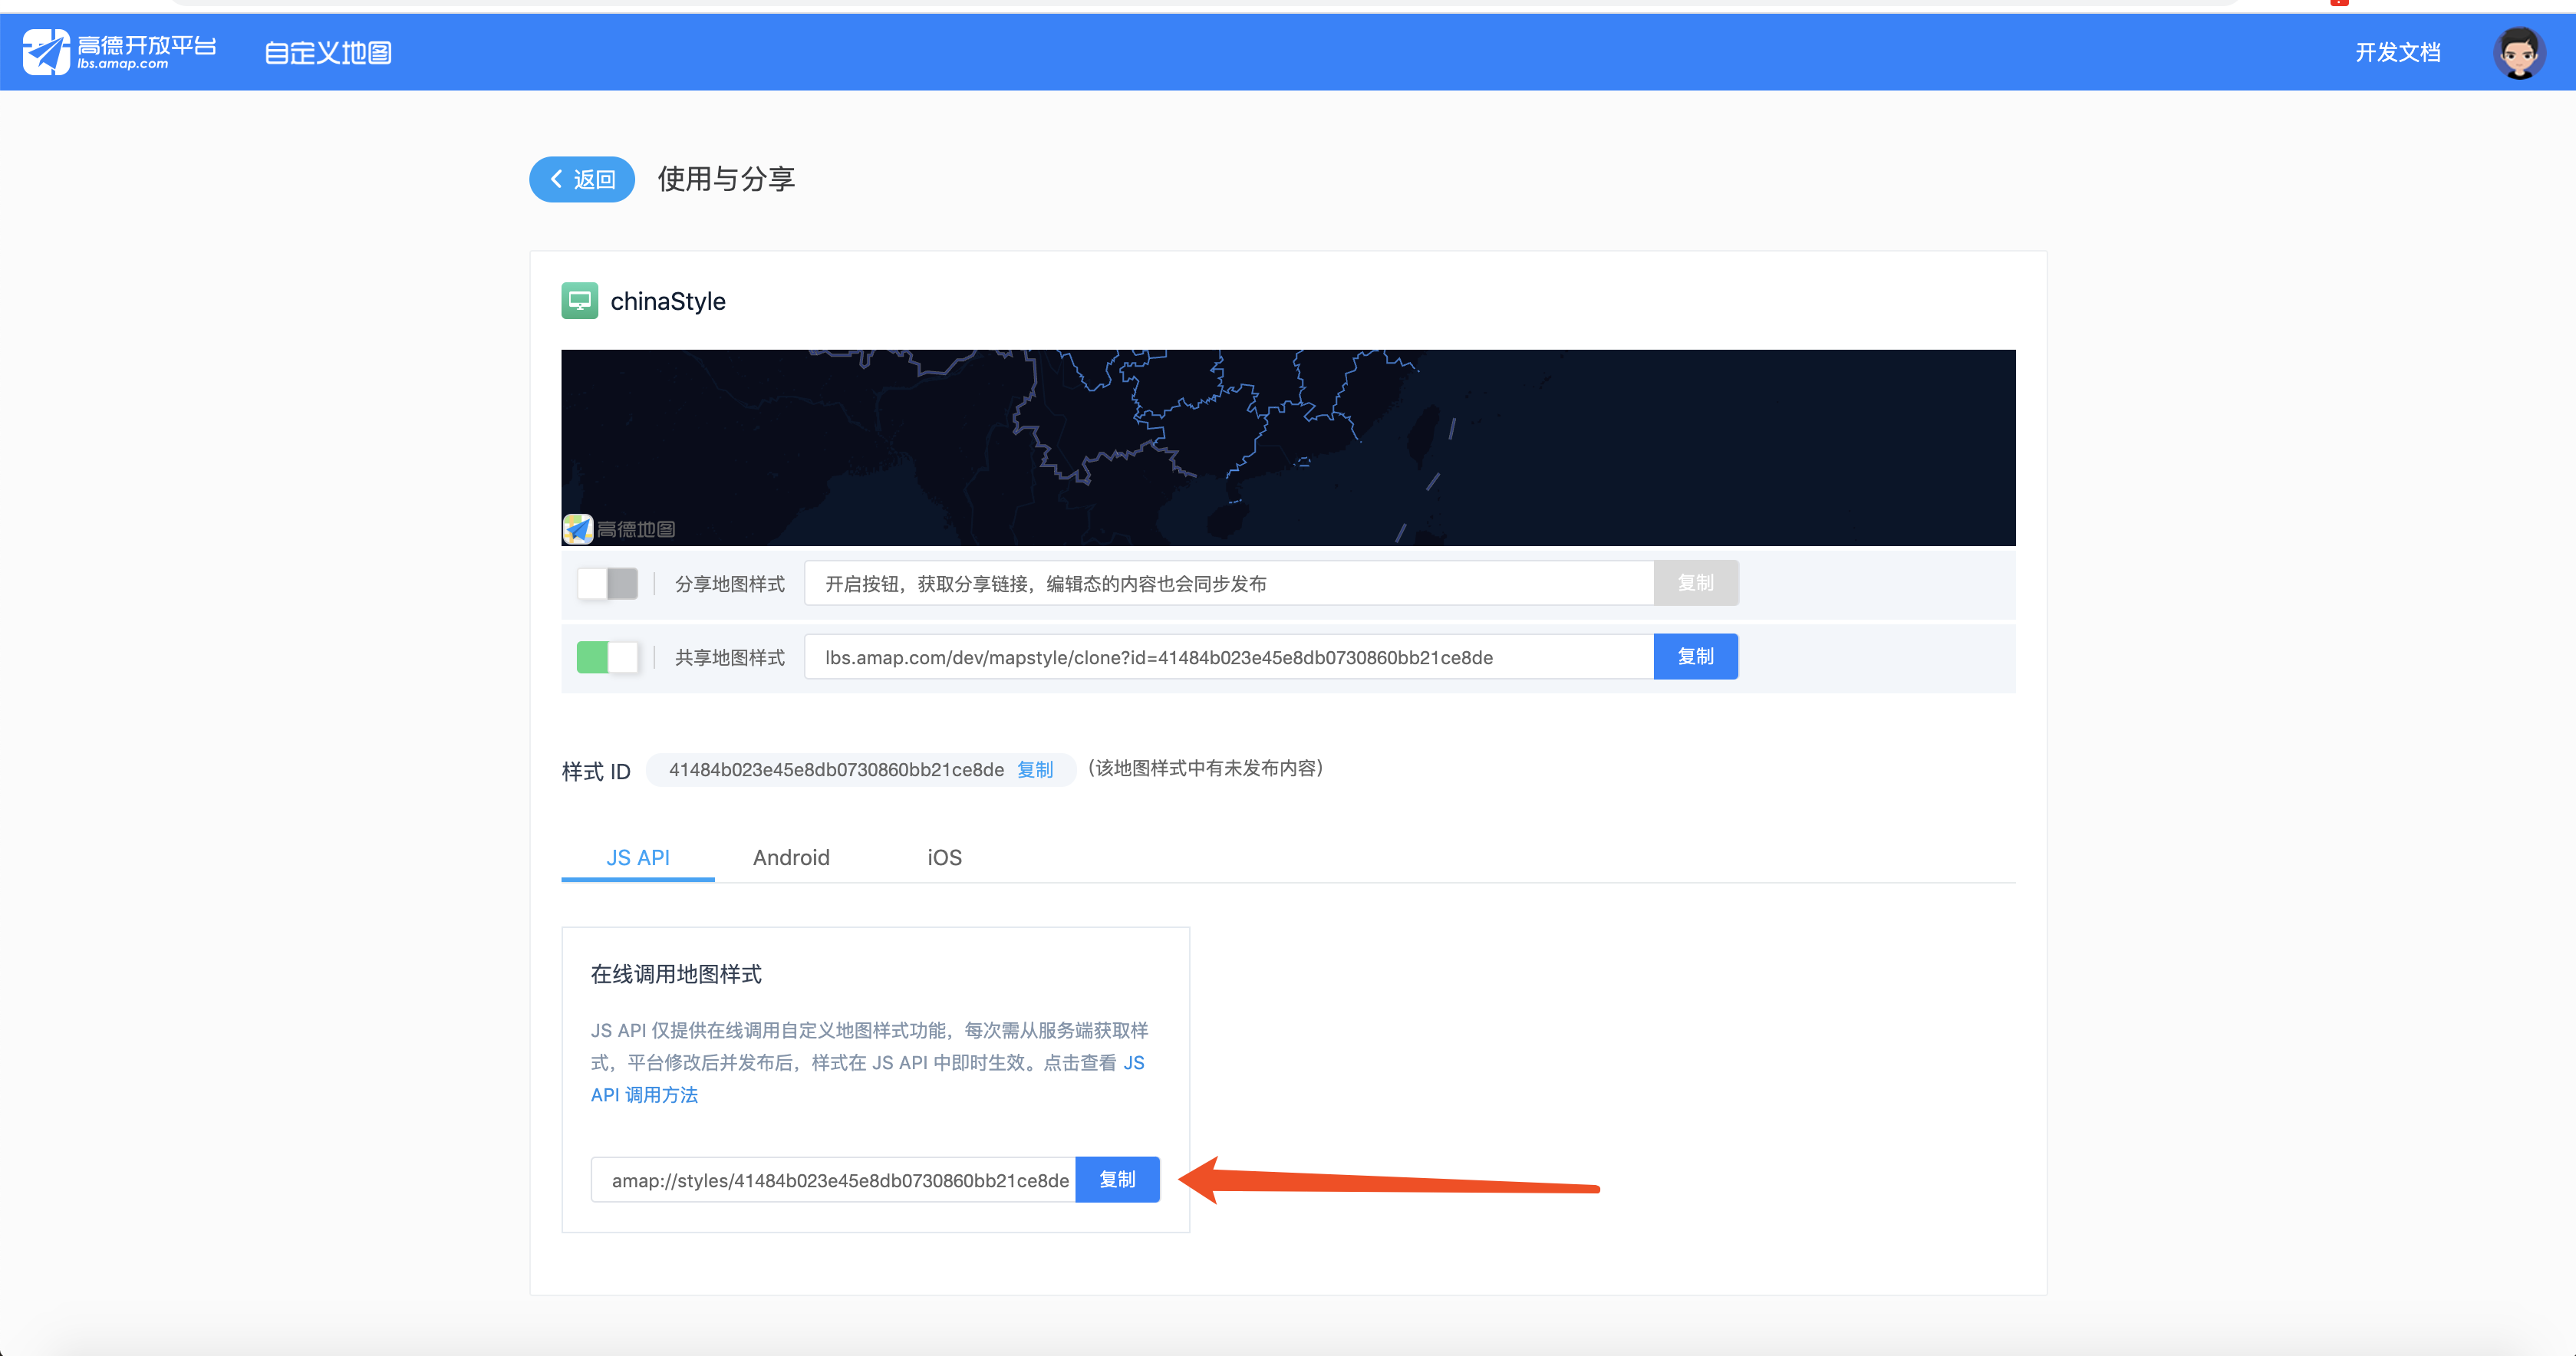
(2)自定义地图样式 高德地图支持自定义地图样式 ,根据需要对地图底图样式进行调整,权限越高,能调整的元素就越多,氪金。可以在高德已有的地图模版上进行自定义。
自定义地图样式,发布后就可以在项目中应用了。
通过地图的mapStyle属性引用
1 mapStyle: "amap://styles/41484b023e45e8db0730860bb21ce8de" ,
注意:地图中使用自定义样式,申请key值的账号,要与自定义地图的账号一致,不然貌似样式会不起作用。
(3)图层 高德地图提供了几种图层插件,例如比较熟悉的卫星图,路况图,还支持第三方,自定义等;可以使地图功能性更强,使区域、边界等达到可视化效果。
例子:简易行政区图层
脚本引入
1 2 3 4 <script src="//webapi.amap.com/maps?v=1.4.15&key=d87dc2da5a41ae6fd9d135acaa50989d&plugin=AMap.DistrictLayer" > </script>
创建实例
1 2 3 4 5 6 7 8 9 10 11 12 13 14 15 16 this .disCountry = new AMap.DistrictLayer.Country({ SOC: 'CHN' , depth: 1 , styles: { 'province-stroke' : 'rgb(112,165,236)' , 'city-stroke' : '#22ffff' , 'coastline-stroke' : '#22ffff' , 'nation-stroke' : '#22ffff' , 'fill' : function ( return 'rgb(5,40,101)' } } }) this .disCountry.setMap(map)
(4)可视化图层Loca Loca是一个基于高德 JS API 地图、纯 JavaScript 实现的地理空间数据可视化渲染引擎,可视化图层种类可能没有echarts丰富,但是基本够用。其特点是在无需了解高德 JS API 的情况下,通过灵活的配置,可以快速制作出如散点、轨迹、区面、热力图等地理位置相关的可视化作品。(区别于高德图层插件,可视化图层更加灵活,更加多样)
例子:散点图层
脚本引入
1 2 <script src="//webapi.amap.com/loca?v=1.3.2&key=d87dc2da5a41ae6fd9d135acaa50989d" ></script>
创建实例
1 2 3 4 5 6 7 8 9 10 11 12 13 14 15 16 17 18 19 20 21 22 23 24 25 26 27 28 29 30 31 32 33 34 35 36 37 38 39 40 41 42 43 44 45 46 let layer = new Loca.PointLayer({ map: this .myAmap }); let pointData = [ {"lnglat" : [99.151158 ,19.181328 ]}, {"lnglat" : [100.36538 ,18.093919 ]}, {"lnglat" : [99.335131 ,16.396768 ]}, {"lnglat" : [103.640098 ,16.183533 ]}, {"lnglat" : [101.395628 ,15.185395 ]}, {"lnglat" : [99.592693 ,14.935099 ]}, {"lnglat" : [99.592693 ,14.935099 ]}, {"lnglat" : [99.592693 ,14.935099 ]}, {"lnglat" : [101.616396 ,13.535306 ]}, {"lnglat" : [102.830576 ,16.541832 ]}, {"lnglat" : [103.124933 ,15.116973 ]}, {"lnglat" : [101.947506 ,17.532988 ]}, {"lnglat" : [101.064436 ,16.541832 ]}, {"lnglat" : [105.038252 ,15.545493 ]} ] layer.setData(pointData, { lnglat: 'lnglat' }); layer.setOptions({ unit: 'px' , style: { radius: 2.2 , color: '#1e5ef6' , borderWidth: 0.5 , opacity: function (params ) if (params.index > 1 ) { let num = (Math .floor(Math .random() * 10 ) + 1 ) / 10 ; if (num < 0.4 ) num = num + 0.2 ; return num; } }, } }); layer.render(); layer.setMap(this .myAmap);
(5)其它的一些api应用
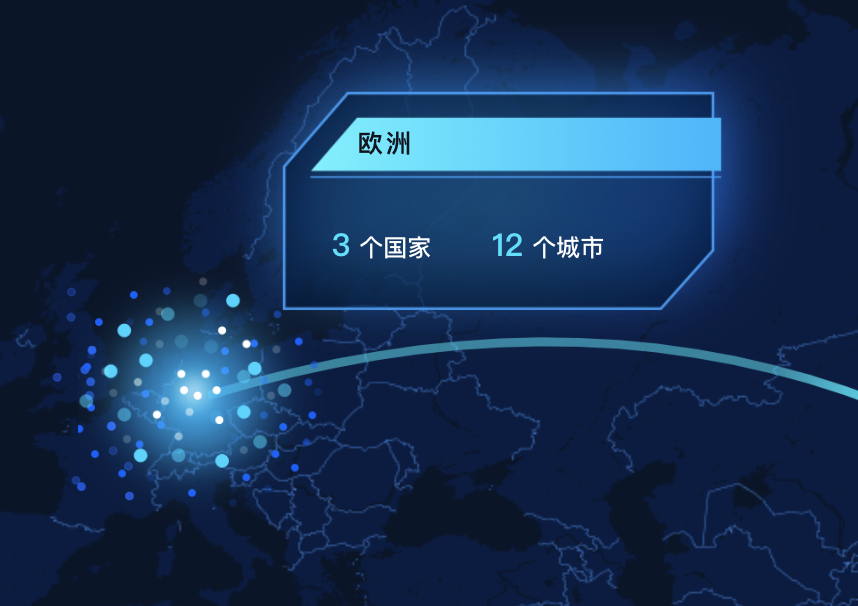
例子1:自定义覆盖物
1 2 3 4 5 6 7 8 9 10 11 12 13 14 15 16 17 18 19 20 21 22 23 24 25 26 27 28 29 30 31 32 33 let size = 250 ;let Icon = new window .AMap.Icon({ size: new window .AMap.Size(size, size), image: image, imageSize: new window .AMap.Size(size, size), imageOffset: new window .AMap.Pixel(-9 , -3 ) }); let marker = new window .AMap.Marker({ position: centerPoint, icon: Icon, offset: new window .AMap.Pixel(-size / 2 , -size / 2 ), }); marker.setMap(this .myAmap); const div = `<div class='continentCard continentCardadeInRight'> <div class="continentCardInfo"> <p class="continentCardCountry">${name} </p> <p class="continentCardContent"> <span><i>${countrys} </i>个国家</span> <span><i>${citys} </i>个城市</span> </p> </div> </div>` let marker1 = new window .AMap.Marker({ position: centerPoint, content: div, offset: new window .AMap.Pixel(cardPosition.left, cardPosition.top) }); marker1.setMap(this .myAmap);
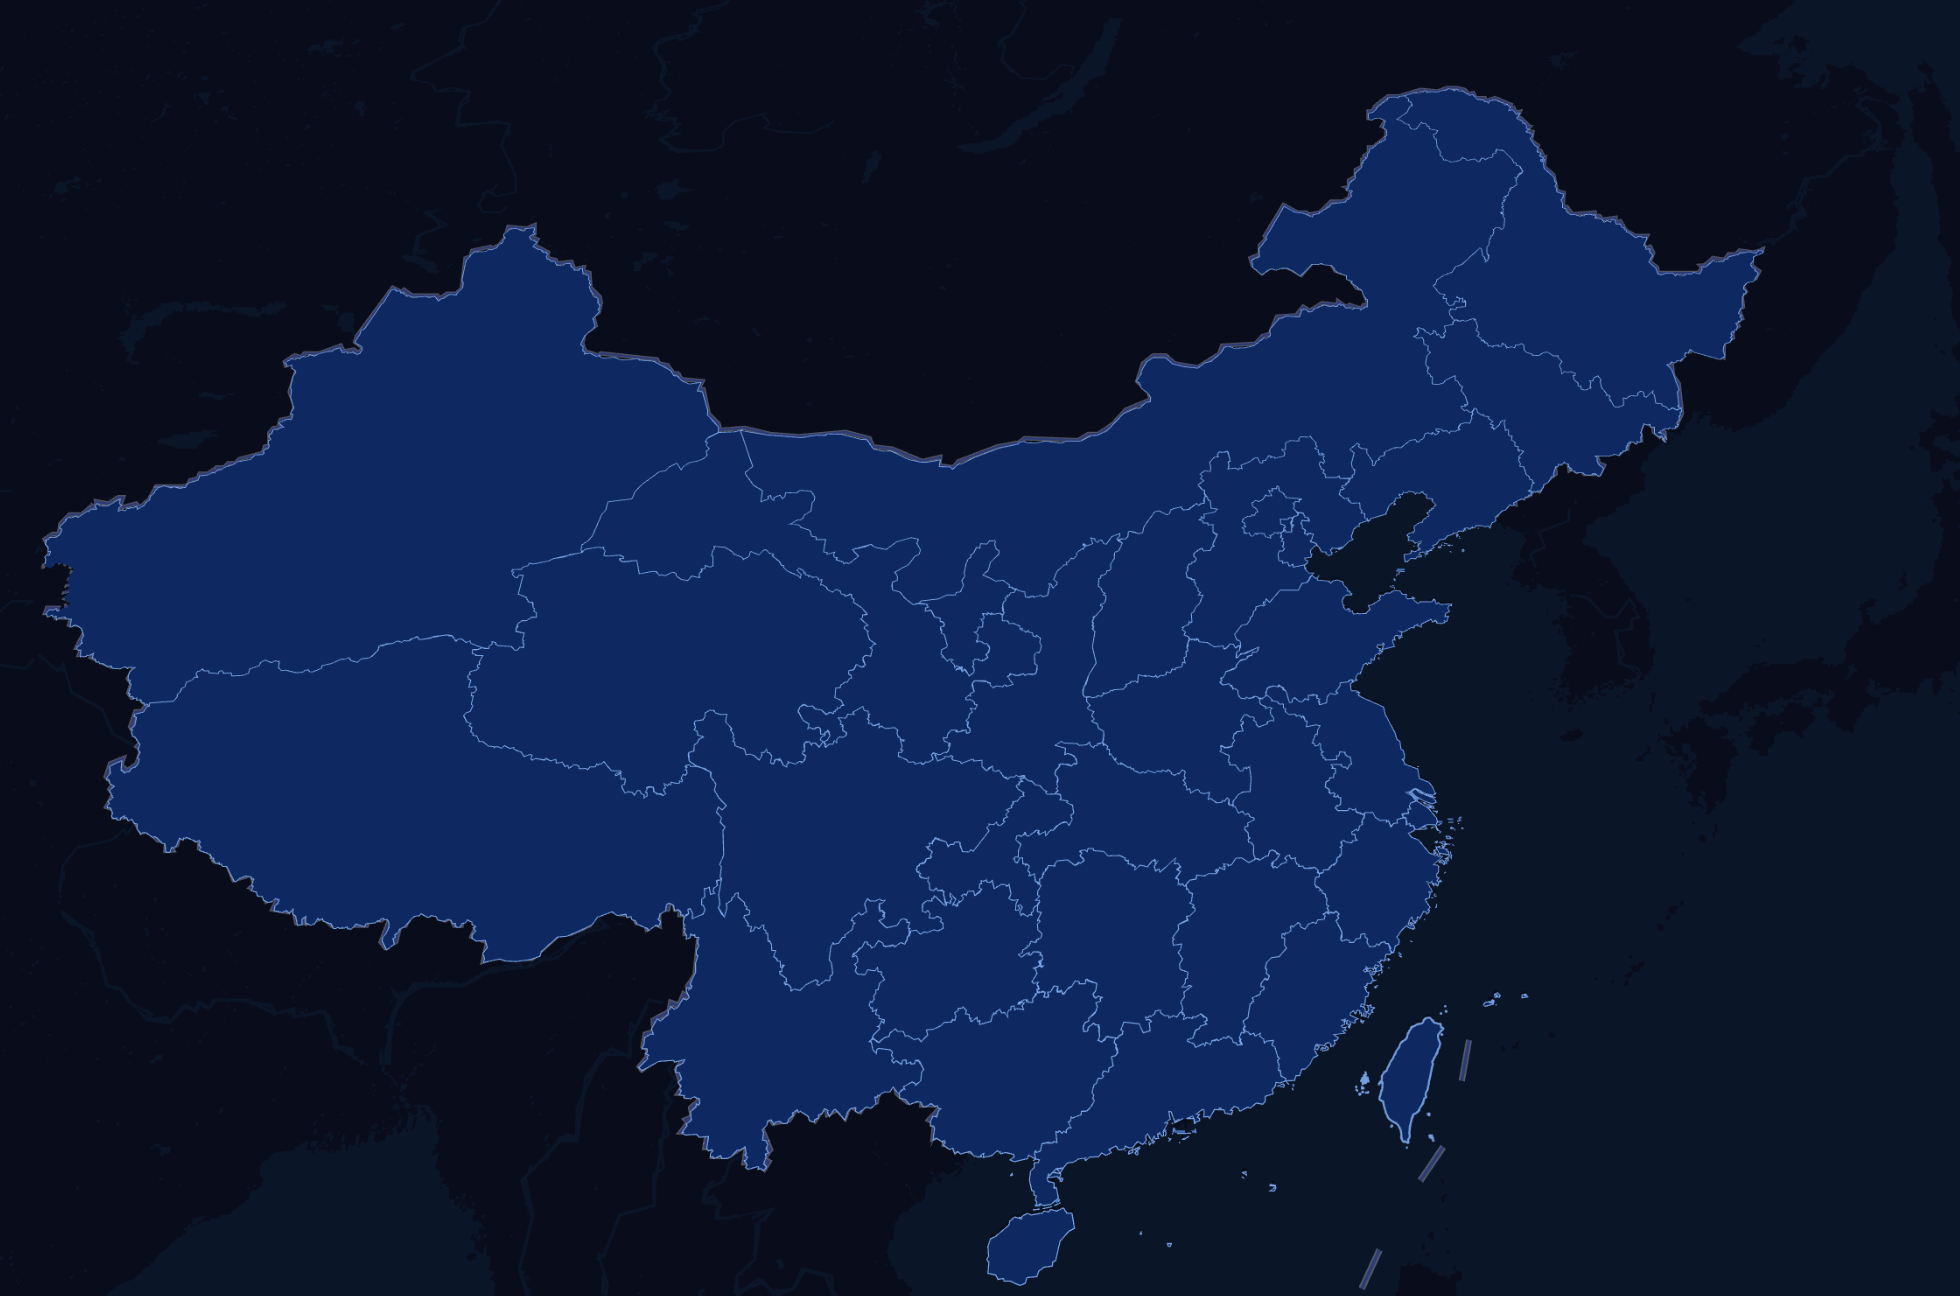
例子2:行政区查询服务
通过行政区查询服务可以获取到查询对象的行政区信息,通过查询到的信息,重新绘制行政区边界
1
2
3
4
5
6
7
8
9
10
11
12
13
14
15
16
17
18
19
20
21
22
let opts = { subdistrict: 0 , extensions: "all" , level: 'coutry' }; let district = new window .AMap.DistrictSearch(opts); let bounds; district.search("中国" , (status, result ) => { bounds = result.districtList[0 ].boundaries; }); for (var i = 0 ; i < bounds.length; i += 1 ) { let item =bounds[i]; new AMap.Polyline({ path: item, strokeColor: '#4eb2f4' , strokeWeight: 2 , map: myAmap }) }
3.Web Worker多线程 因为javascript是在单线程环境中的,无法同时运行多个脚本,也就是说要等一段代码执行完后,才能继续往下执行,假如要做复杂计算的话,页面就可能会出现卡顿几秒的情况。
使用限制 (1)同源限制
例子:中国边界点计算 因为要重新绘制中国边界,但是获取到的点非常多,导致渲染需要很长时间,所以通过计算排除掉一部分的点,减少点的数量,提高渲染速度。因为计算也要很长时间,所以创了个worker线程来计算,避免阻塞主线程。
主线程js
1 2 3 4 5 6 7 8 9 10 11 12 13 14 15 16 17 18 19 20 let worker = new Worker("./calc.js" );let opts = { subdistrict: 0 , extensions: "all" , level: 'coutry' }; let district = new window .AMap.DistrictSearch(opts);district.search("中国" , (status, result ) => { let bounds = result.districtList[0 ].boundaries; worker.postMessage(bounds); }) worker.addEventListener('message' , (event ) => { window .chinaBounds = event.data; worker.terminate(); }, false );
子线程脚本calc.js
1 2 3 4 5 6 7 8 9 10 11 12 13 14 15 16 17 18 19 20 var calc = function (data ) let bounds = []; for (let i in data){ if (data[i].length > 50 ){ let item = []; for (let j in data[i]) { if (j % 10 === 0 ) item.push(data[i][j]); } bounds.push(item); } } return bounds; }; onmessage = function (event ) postMessage(calc(event.data)); };
参考链接 Web Worker使用教程–阮一峰 MDN-Web Workers概念与用法 JavaScript 工作原理之七-Web Workers 分类及 5 个使用场景
4.地图图层转图片 由于地图加载、渲染的耗时比较久,用户体验不大好,所以第一次加载后,把地图图层转换成图片,用localStorage存储起来,后续直接用图片作为地图的底图,从而提高页面的性能与加载速度。
1 2 3 4 5 6 7 8 9 10 11 12 13 14 15 16 17 18 19 20 21 22 23 24 25 26 27 28 29 30 31 32 33 34 function setLayoutPic (params ) let canvas = document .getElementsByClassName('amap-layer' )[0 ] var base64Img = canvas.toDataURL('image/jpg' ); localStorage .setItem('a' , base64Img) } function getLayout (params ) let canvas = document .createElement('canvas' ) let img = document .createElement('img' ) var size = keDatasMap.getSize(); var width = size.width; var height = size.height; canvas.style.width = width + 'px' canvas.style.height = height + 'px' canvas.width = width; canvas.height = height; var ctx = canvas.getContext("2d" ); img.src = localStorage .getItem('a' ) img.onload = () => { ctx.drawImage(img, 0 , 0 , width, height) var customLayer = new AMap.CustomLayer(canvas, { zIndex:5 }); window .customLayer = customLayer customLayer.setMap(keDatasMap) } }
5.echarts (1)echarts的高德地图扩展echarts-amap 因为想要用echarts的飞线,但是呢,echarts自带的地图扩展只有百度地图,最后用了这个别人写的一个库。echarts-amap 支持echarts所有类型图表,只是将地理坐标系换成amap,其他跟geo,bmap基本一致,是基于extension-bmap改造的。所以echarts官网图表怎么结合bmap使用,就怎么结合amap使用。
1 2 3 4 5 6 7 8 9 10 11 12 13 14 15 16 17 18 19 20 21 22 23 24 25 26 require ('echarts-amap' ); let chart = echarts.init(document .getElementById("keDatasMap" ));let option = { amap: { maxPitch: 60 , pitch: 15 , viewMode: '3D' , zoom: 3.22 , expandZoomRange: true , zooms: [3 , 20 ], mapStyle: "amap://styles/61705e9081eaf0787d3e504a15209c64" , center: [121.52223 , 31.489085 ], rotation: 0 , dragEnable: false , zoomEnable: false , showLabel: false , }, series: [] } chart.setOption(option); let myAmap = chart.getModel().getComponent('amap' ).getAMap();
(2)飞线图-lines
用的是echarts-lines (注意:飞行太快的话,那个线可能就一卡一卡的,点点分明,当然也有可能是我电脑太烂带不动。)
1
2
3
4
5
6
7
8
9
10
11
12
13
14
15
16
17
18
19
20
21
22
23
24
25
26
27
28
29
30
31
32
33
34
35
36
37
38
39
this .option.series.push( { name: "线路" , type: "lines" , coordinateSystem: "amap" , zlevel: 2 , large: true , animationDuration: 1000 , animationEasing: "linear" , effect: { show: true , loop: false , period: 1 , trailLength: 0 , symbol: `image://${lightImg} ` , symbolSize: [50 , 100 ] }, lineStyle: { normal: { color: { type: 'linear' , x: 0.5 , y: 0.5 , x2: 1 , y2: 1 , colorStops: [ { offset : 0 , color : 'rgba(4,237,254,0.5)' }, { offset : 0.25 , color : 'rgba(4,237,254,1)' }, { offset : 1 , color : 'rgba(10,247,255,0)' } ], }, width: 5 , opacity: 1 , curveness: name === "欧洲" || name === "亚洲" ? -0.3 : 0.3 , } }, data: moveLines }); this .chart.setOption(this .option);
6.图片预加载 因为大屏各个页面用到的图片比较多,比较大,在浏览器没缓存图片的情况下,进入页面再加载图片会导致页面渲染完,但是图片资源还没准备好,首屏效果、体验不大好,所以对图片进行预加载。
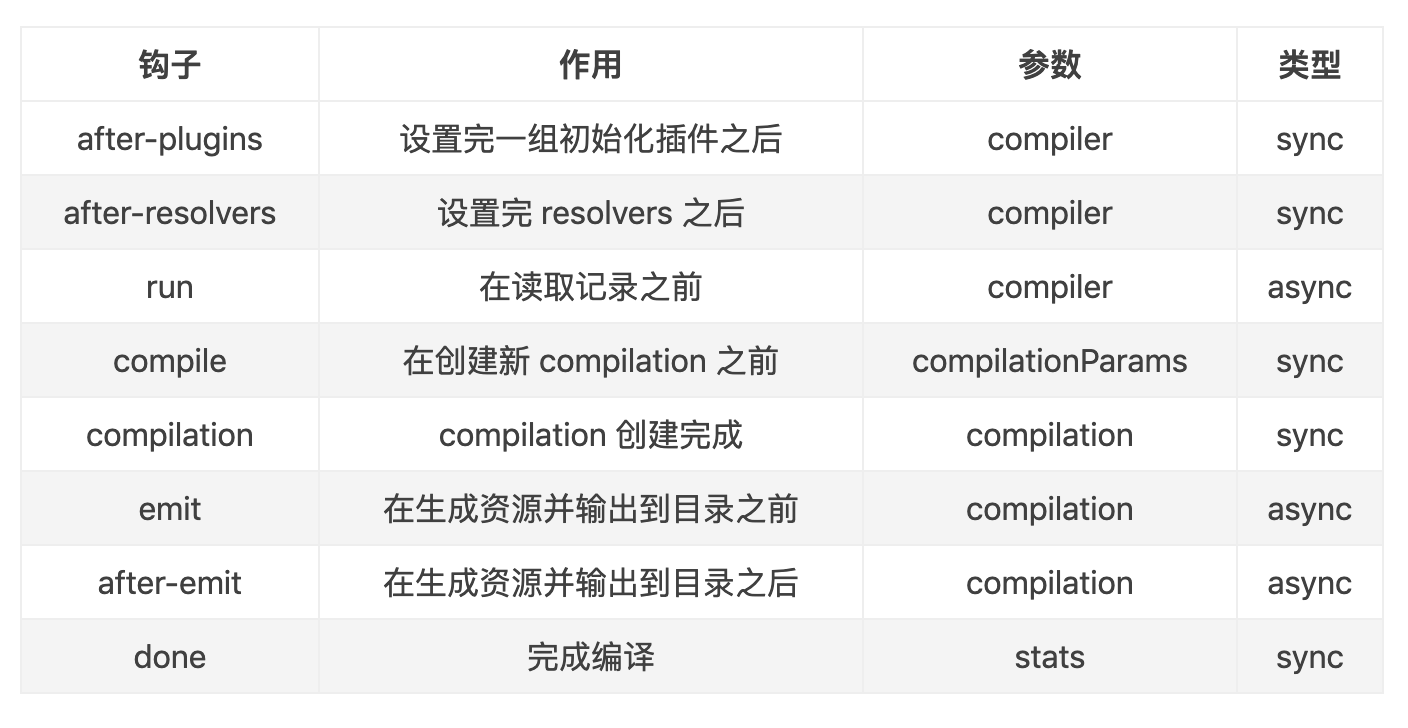
webpack插件 webpack 插件有以下特点:
事件钩子:事件钩子其实就是类似 MVVM 框架的生命周期函数,在特定阶段能做特殊的逻辑处理。
webpack.config.js
1 2 3 4 5 6 7 8 9 10 11 12 13 const BasicPlugin = require ('./BasicPlugin.js' ); plugins: [ new BasicPlugin(() => { console .log(123 , 'end' ); }, (err ) => { console .error(err); }), ]
BasicPlugin.js
1 2 3 4 5 6 7 8 9 10 11 12 13 14 15 16 17 18 19 20 21 22 23 24 25 26 27 28 29 30 31 32 33 34 35 36 37 38 39 40 41 42 43 const fs = require ('fs' )const path = require ('./paths' )const paths = require ('path' )const appPublic = path.appPublic const servedPath = path.servedPathconst JSonPath = paths.resolve(appPublic, 'imgUrl.js' );class BasicPlugin constructor (doneCallback, failCallback) { this .doneCallback = doneCallback; this .failCallback = failCallback; } apply(compiler) { compiler.plugin('emit' , function (compilation, callback ) const ImgPattern = /.(jpg|png)$/ let arr = [] for (var filename in compilation.assets) { if (ImgPattern.test(filename)) { arr.push(servedPath + filename) } } fs.writeFileSync(JSonPath, `window.imageUrl = ${JSON .stringify(arr)} ` ); compilation.assets['imgUrl.js' ] = { source: function ( return `window.imageUrl = ${JSON .stringify(arr)} ` }, size: function ( return arr.length; } }; callback(); }); } } module .exports = BasicPlugin;
图片预加载 项目中,图片加载与加载中的进度结合,加载完成后,进度显示100%,正式加载页面组件
1 2 3 4 5 6 7 8 9 10 11 12 13 14 15 16 17 18 19 20 21 22 23 24 25 26 27 28 29 30 31 32 33 34 35 36 37 imageUpload = (arr ) => { let { load, process } = this .state const len = arr.length const part = (100 - process) / arr.length arr.forEach(src => this .creatImage(src, () => { load++ process += part; if (load === len) { process = 100 setTimeout (() => { this .setState({ loaded: true }) }, 1200 ) } this .setState({ load, process }) }) }); } creatImage = (src, callback ) => { const img = new Image() img.src = src img.onload = () => { callback() } img.onerror = () => { callback() } }
也可以用上面提到的Web Worker,进行图片预加载,参考Web Worker在项目中的妙用
参考链接 探寻webpack插件机制 webpack原理-编写Plugin 图片预加载的三个方法
7.一些动画效果 (1)边框动画:逆时针画出边框
大概逻辑就是定义4个高度、宽度为0的元素,相对定位在父元素的四个顶点top0,left:0,bottom:0,right:0,给每条边添加不同时间的动画,绘制元素的高度/宽度
上
width: 0px;
height:0px;
width: 100%;
height: 1px;
0.4s
左
width: 0px;
height:0px;
width: 1px;
height: 100%;
0.8s
下
width: 0px;
height:0px;
with: 100%;
height: 1px;
1.2s
右
width: 0px;
height:0px;
with: 1px;
height: 100%;
1.6s
页面代码
1 2 3 4 5 6 7 <div className={styles.tab}> <span className={styles.top}></span> <span className={styles.left}></span> <span className={styles.bottom}> </span> <span className={styles.right}></span> </div>
css
1 2 3 4 5 6 7 8 9 10 11 12 13 14 15 16 17 18 19 20 21 22 23 24 25 26 27 28 29 30 31 32 33 34 35 36 37 38 39 40 41 42 43 44 45 46 47 48 49 50 51 52 53 54 55 56 57 58 59 60 61 62 63 64 65 66 67 68 69 70 71 72 73 74 75 76 77 78 79 80 81 82 83 84 85 86 87 88 89 90 91 92 93 94 95 96 97 98 99 100 101 102 103 104 105 106 107 108 109 110 111 112 113 114 115 116 117 118 119 120 121 122 123 124 125 126 127 128 129 130 131 132 133 134 135 136 137 138 139 140 141 $color: rgba(22 , 233 , 252 , 0.36 ); .tab { position: absolute; background: rgba(0 , 0 , 0 , 0.3 ); top: 214 px; right: 90 px; width: 510 px; height: 730 px; background-size: 100 % 100 %; } %after { content: "" ; position: absolute; width: 8 px; height: 8 px; border-radius: 100 %; border-top: 1 px solid $color; opacity: 0 ; } .left { left: 0 ; top: 4 px; &:after { @extend %after; transform: rotate(-45 deg); top: -4 px; left: 1 px; } } .bottom { left: 4 px; bottom: 0 px; &:after { @extend %after; transform: rotate(-135 deg); top: -9 px; left: -3 px; } } .right { right: 0 ; bottom: 4 px; &:after { @extend %after; transform: rotate(135 deg); bottom: -4 px; left: -8 px; } } .top { right: 4 px; top: 0 ; &:after { @extend %after; transform: rotate(45 deg); bottom: -8 px; right: -4 px; } } @keyframes lr { from { height: 0 ; width: 1 px; } to { height: calc(100 % - 8 px); width: 1 px; } } @keyframes tb { from { width: 0 ; height: 1 px; } to { width: calc(100 % - 8 px); height: 1 px; } } @keyframes after { from { opacity: 0 ; } to { opacity: 1 ; } } @mixin set-styles($arg) { @if #{$arg} { @extend .#{$arg}; } } $delay:0 ; $iconFont: ((cl:top), (cl:left), (cl:bottom), (cl:right), ); @for $i from 1 through length($iconFont) { $item: nth($iconFont, $i); $cl: map-get($item, cl); $an: if ($i % 2 ==1 , tb, lr); $duration: 0.4 s; $delay: $delay + $duration; .#{$cl} {s animation: $an $duration ease $delay 1 normal forwards; position: absolute; background: $color; height: 0 ; width: 0 ; @include set-styles($cl); } .#{$cl}:after { animation: after 0.1 s ease $delay 1 normal; animation-fill-mode: forwards; } }
参考链接:Sass中文文档
(2)圆圈动画
大概逻辑就是通过动画改变透明度和旋转角度实现效果。=value]:=base];选择自定义属性data-anim包含单词 “base” 的所有元素。
rect (top, right, bottom, left);clip: rect(0px, 42px, 100px, 0px),即右边裁剪42px,底部裁剪100px。
页面代码
1 2 3 4 5 6 7 8 9 10 11 <div className={styles.meteorology}></div> <div className="wrapper" > <div className="circle" data-anim="base left" ></div> </div> <div className="wrapper1" > <div className="circle" data-anim="base right" ></div> </div>
css
1 2 3 4 5 6 7 8 9 10 11 12 13 14 15 16 17 18 19 20 21 22 23 24 25 26 27 28 29 30 31 32 33 34 35 36 37 38 39 40 41 42 43 44 45 46 47 48 49 50 51 52 53 54 55 56 57 58 59 60 61 62 63 64 65 66 67 68 69 70 71 72 73 74 75 76 77 78 79 80 81 82 83 84 85 86 87 88 89 90 91 92 93 94 95 96 97 98 99 100 101 102 103 104 105 106 107 108 109 110 111 112 .meteorology { background-image: url('~@/assets/meteorology.png' ); width: 82 px; height: 82 px; background-repeat: no-repeat; background-size: 45 px; position: absolute; background-position: -3 px -4 px; z-index: 1 ; transform: rotate(-150 deg); animation: rotate 1 s linear 1.8 s forwards; opacity: 0 ; } @keyframes rotate { from { transform: rotate(-150 deg); opacity: 1 ; } to { transform: rotate(0 deg); opacity: 1 } } .wrapper { width: 80 px; height: 80 px; position: absolute; clip: rect(0 px, 100 px, 100 px, 42 px); } .wrapper1 { width: 80 px; height: 80 px; position: absolute; clip: rect(0 px, 46 px, 100 px, 0 px); -webkit-animation-name: close-wrapper; animation-delay: 1.8 s; } .circle { width: 80 px; height: 80 px; border: 1px solid #16694D; border-radius: 40 px; position: absolute; clip: rect(0 px, 42 px, 100 px, 0 px); } div[data-anim~=base] { -webkit-animation-iteration-count: 1 ; -webkit-animation-fill-mode: forwards; -webkit-animation-timing-function : linear ; /* Linear animation */ } //设置类circle 中自定义属性data -anim 的值包含left 的元素的样式 .circle[data-anim~=left] { -webkit-animation-duration: 1 s; -webkit-animation-name: left-spin; animation-delay: 1.8 s; } .circle[data-anim~=right] { -webkit-animation-duration: 1 s; -webkit-animation-name: left-spin1; animation-delay: 1.8 s; opacity: 0 ; } @-webkit-keyframes left-spin { from { -webkit-transform: rotate(0 deg); } to { -webkit-transform: rotate(180 deg); } } @-webkit-keyframes left-spin1 { from { opacity: 1 ; -webkit-transform: rotate(180 deg); } to { opacity: 1 ; -webkit-transform: rotate(360 deg); } }
参考链接:HTML data-* 属性 CSS3选择器 css clip属性
二、问题总结 1.性能问题 (1)定时器太多 解决方案:每个页面只使用一个定时器,移除组件时清除定时器。
(2)每次切换页面都重新加载渲染地图 解决方案:页面初始加载时,加载地图,切换页面不销毁地图,清除地图上面的覆盖物,只对地图图层做显示/隐藏操作。
2.屏幕适配/浏览器兼容问题 (1)屏幕适配问题 设计稿尺寸是1920*1080,用户客户端屏幕大小不一
(2)浏览器兼容 地图渲染要支持webgl,还有好的动画效果对浏览器有 一定的要求
3.开发效果与UI预期效果不一致 例如全国地图的显示与UI设计稿的效果 是有差别的,有些可能不能完全还原UI的效果
4.层级问题 解决方案:
三、多说一句 因为是挺久之前做的大屏项目,可能高德地图、百度地图,echarts等等都已经越来越完善,推出了很多新功能,或者有更好的库,更好的解决方案,需要进一步去探索研究。